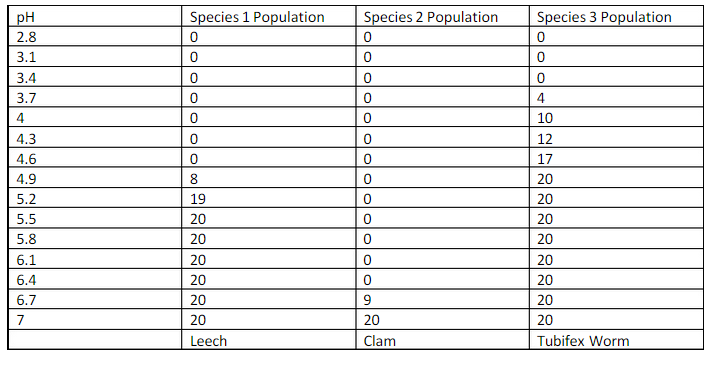
1: What are the names of the species used in this experiment? Which of these species was the most tolerant of increased acidity in the aquarium? Which species was the least tolerant? The names of the species are the leech, clam, and the tubifex worm. The species most tolerant to increased acidity was the tubifex worm and the least tolerant species was the clam.
2: Describe how acid precipitation affects ecosystems.
When acid precipitation occurs, the acid would get into the water and acidify it. When the water gets more acidic, the shells of the clams can dissolve due to the more carbonic acid in the water. More clams would die, meaning that there is less food for the little fish to eat. Without any clams for the small fish, they would die and that means no food for the bigger fish. The bigger fish then die, and us humans don't have any fish at all to eat.
3: What is an indicator species? How are indicator species used to assess pollution levels in the environment?
Indicator species are species that alert us when there is pollution problems. Indicator species are used to asses pollution levels in the environment by their behavior in certain conditions. These conditions include food availability, water, temperature, amount of dissolved water in the water, pH levels, and other factors.
4: Suppose you are an ecologist studying the effects of acid precipitation of plant life. Describe an experiment you would perform in order to determine which plant species would be an useful indicator species for acid rain pollution.
I would use 3 species of plants. Each species has one control and one experimental. The control would have water with a neutral pH. The experimental would have a pH of 5. I would place the plants in the water for at 30 minutes. When the experimental plants are checked I would observe if the plants behavior has changed or not for example if the petals are clumped together or are spread apart. The plant that shows any obvious signs would be a great indicator indicator species for acid rain pollution.
5: How do the data represented on the Population Bar Graph compare to the data represented in the line graph titled, “Populations of Aquatic Invertebrates at Various pH Levels?"
The bar graph shows the current population based upon the pH level. The line graph shows the changes in the population as the pH of the water gets lower.
